The Bitrise dashboard
Your first stop when logging in to Bitrise is the dashboard. It shows your current workspace's most important information across a number of different Bitrise products.
Your first stop when logging in to Bitrise is the dashboard. It allows you to navigate the Bitrise products across your current workspace. You can navigate to:
-
Your projects.
-
Your CI builds on your workspace's CI dashboard.
-
The Bitrise Build Cache.
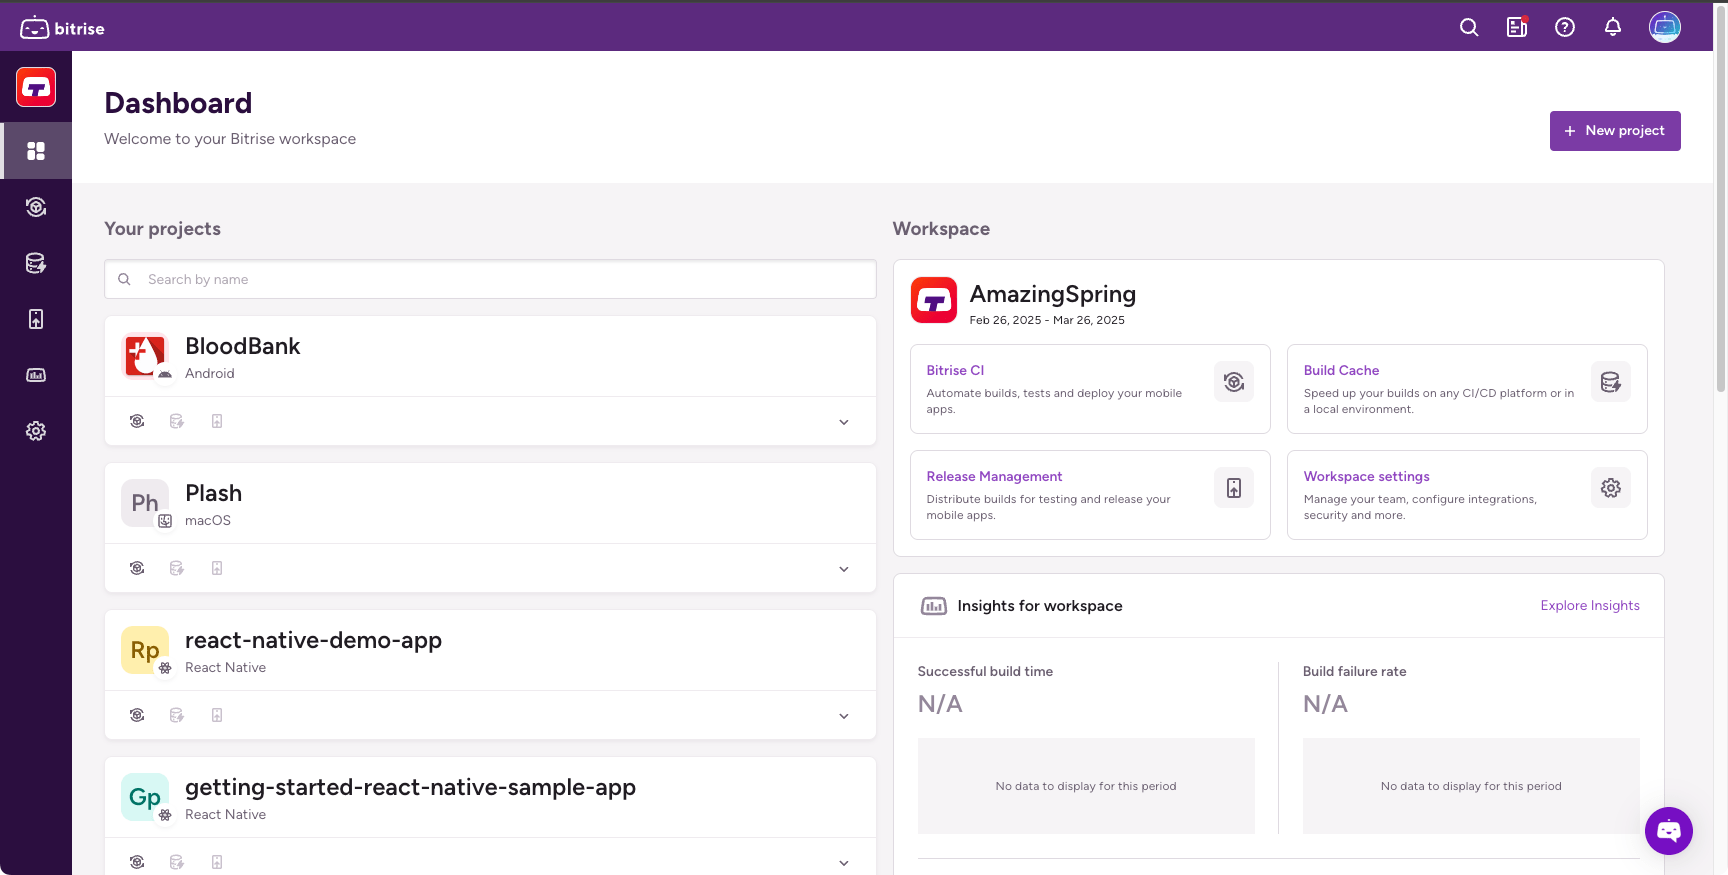
You can also find Insights data for the workspace.
Checking project details
Your projects are listed on the left side of the dashboard. To see more data about them, click the downward arrow.
The details display basic information about all Bitrise products associated with the project:
-
The last Bitrise CI build, its status, and the branch it ran on.
-
The last time the Build Cache was used.
-
The number of connected apps the project has in Release Management.
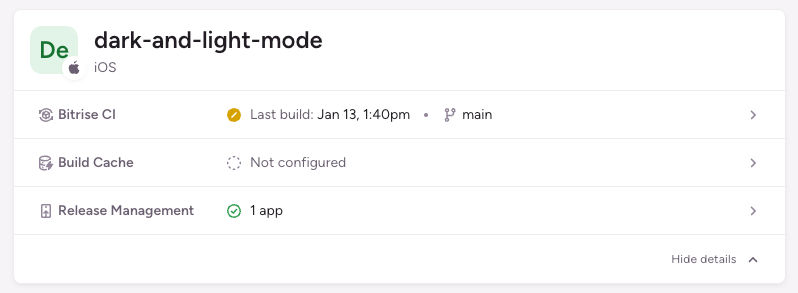
You can access each of these products from the details section of the project card.
Adding a new project from the dashboard
On the top right corner of the dashboard, you can find the button. You can use this to add a new project with a CI configuration.
Projects without CI
You can create projects without a CI configuration: add a new app to Release Management and select the option to create a new project.
Any CI project added this way will also be visible on the dashboard. You can also access Release Management to add an app and link it to the project.
Workspace insights
In the Insights for workspace section, you can see some basic aggregated data for your workspace's projects:
-
Successful build time: The average Bitrise CI build time for successful builds across the workspace's projects.
-
Build failure rate: The percentage of failed Bitrise CI builds across the workspace's projects.
-
Cache hit rate: The percentage of data requests that were successfully served by the Bitrise Build Cache.
-
Command error rate: The percentage of failed commands.
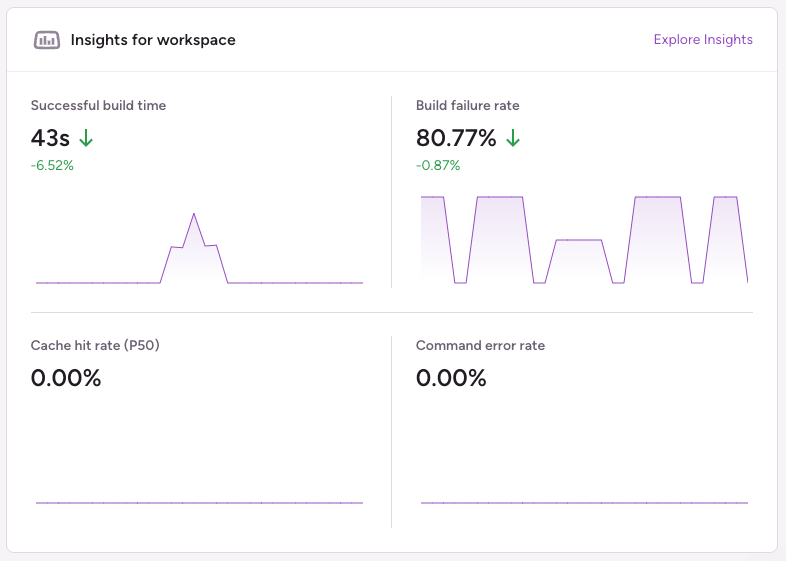
Explore Insights to see more metrics, providing data-driven visibility.